
Wouter Bijnens A , Kenneth Meijer B , Guy Plasqui B
A Research Engineering, Maastricht University, The Netherlands
B Department of Nutrition and Movement Sciences, Maastricht University, The Netherlands
Introduction
Regular physical activity (PA) is proven to help prevent and treat several noncommunicable diseases such as heart disease, stroke, and diabetes. 1 Intensity is a key characteristic of PA that can be assessed by estimating energy expenditure (EE). However, the accuracy of the estimation of EE based on accelerometers are lacking. 2 It has been suggested that the addition of physiological signals can improve the estimation. 3 How much each signal can add to the explained variation and how they can improve the estimation is still unclear.
The goal of the current study is twofold:
- To explore the contribution of heart rate (HR), breathing rate (BR) and skin temperature to the estimation of EE
- Develop and validate a statistical model to estimate EE in simulated free-living conditions based on the relevant physiological signals.
Participants
56 healthy subjects, aged 18-64
Data Collection
- Sex / Age / Body Length / Body Weight
- Deuterium Dilution for total body water measurement
- MOX1 Accelerometers placed at:
- Upper Leg / Waist / Wrist
- MOX7 ECG Logger measures:
- 1 Lead ECG / Bioimpedance for Breathing Rate / Acceleration
- Polar H10 chest band for heart rate and RR intervals
- iButton Temperature sensors placed at:
- Shin / Upper Leg / Chest / Shoulder
- Energy Expenditure via indirect calorimetry with respiration chamber
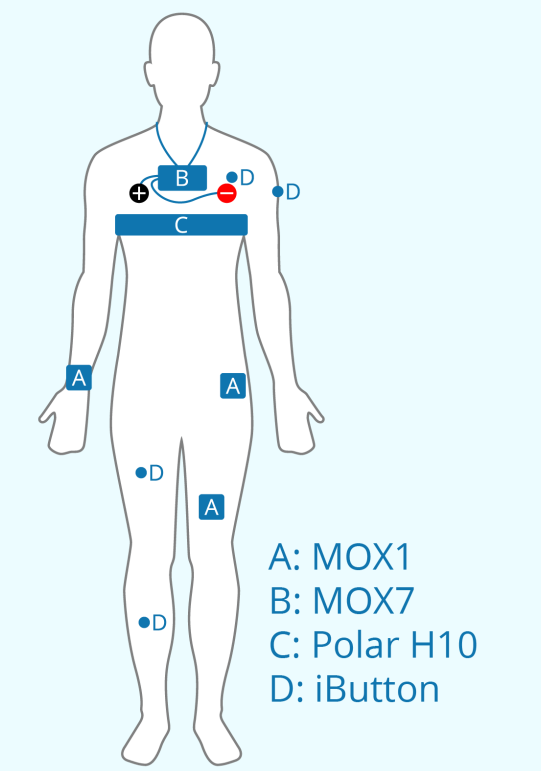 Figure 1: Placement of wearables
Simulated Free-Living Protocol
| Standing Deskwork | 15 minute activation session | Sedentary Reading |
| Sedentary Deskwork | 15 minute Stepping Exercise | Lying watching short film |
| Household chores | Household chores | Gaming |
Table 1: Activities included in the simulated free-living protocol
Treadmill Protocol
- 6 walking / running speeds
- 2km/h 3.5 km/h 5km/h 6.5 km/h 8km/h 9.5 km/h
- 8 minutes per stage
Proposed Analysis Flowchart
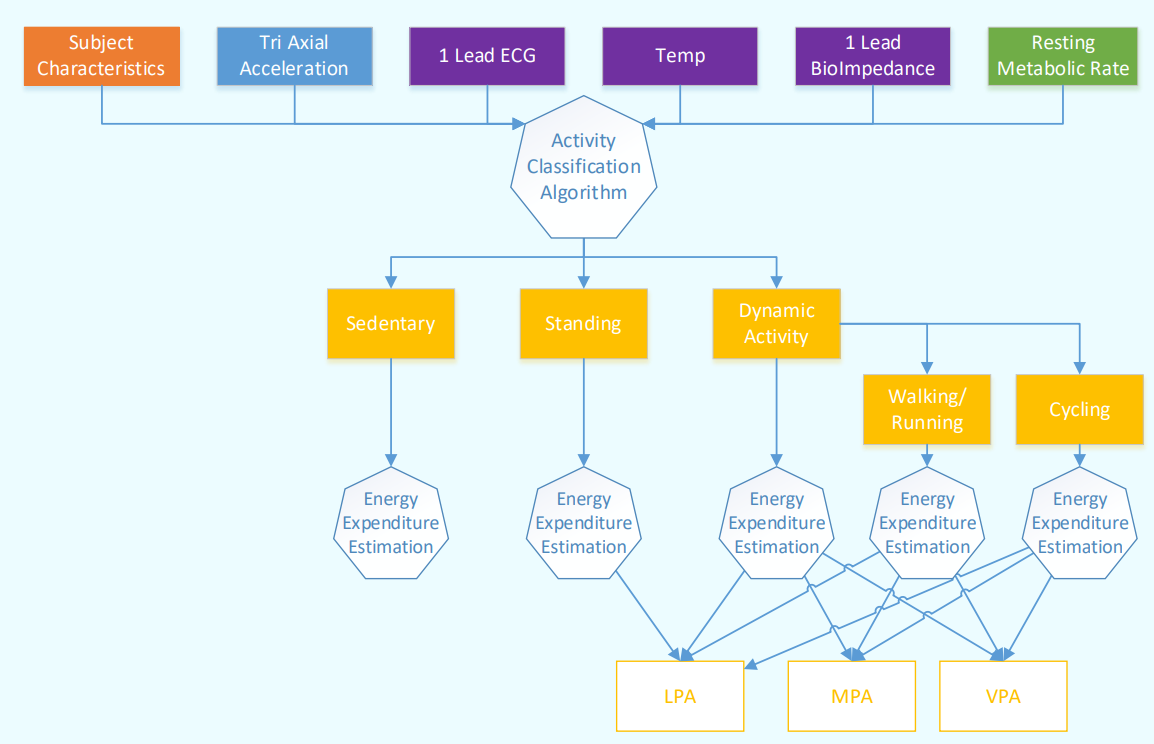 Figure 2: Proposed analysis flowchart
Preliminary Results
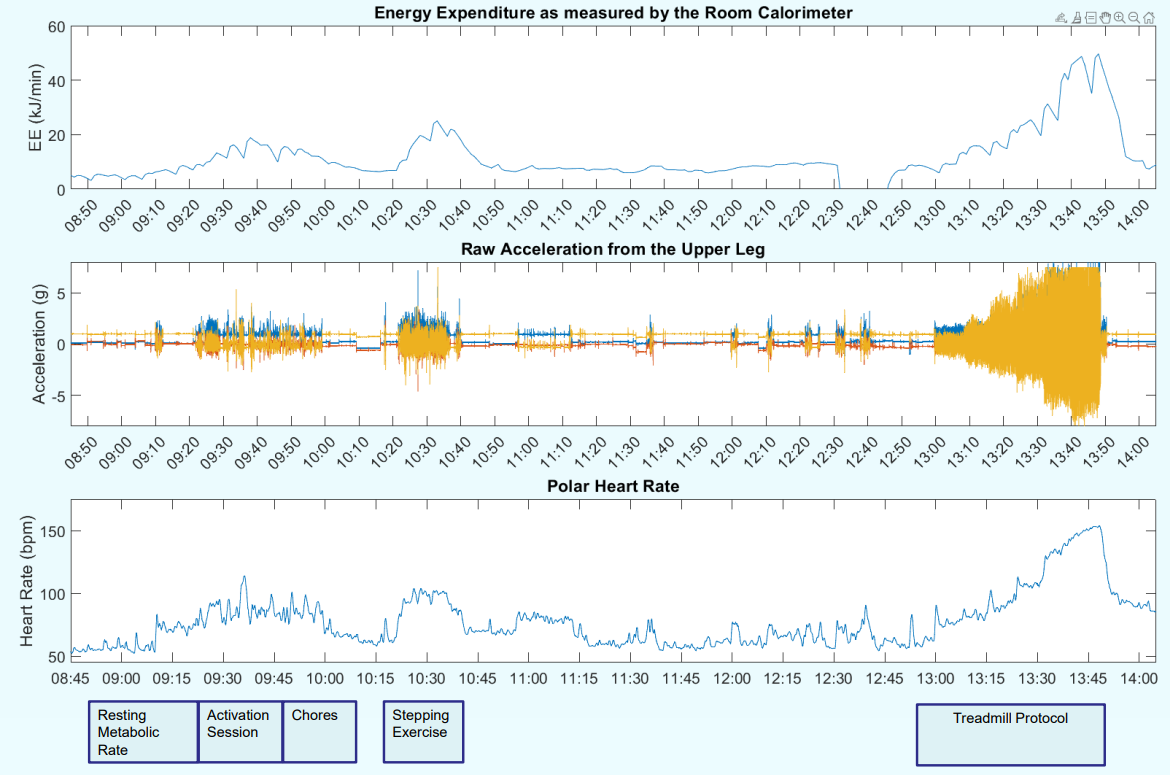 Figure 3: Example data of the energy expenditure measured by the respiration chamber, raw acceleration from the upper leg and heart rate measured by Polar
References
[1] World Health Organization, Global action plan on physical activity 2018–2030: more active people for a healthier world. 2018.
[2] Alvarez-Garcia, J., B. Cvetković, and M. Lustrek, A Survey on Energy Expenditure Estimation Using Wearable Devices. ACM Computing Surveys, 2020. 53: p. 1-35.
[3] Burchartz, A., et al., Assessing physical behavior through accelerometry – State of the science, best practices and future directions. Psychology of Sport and Exercise, 2020. 49: p. 101703.
This work was labelled by ITEA3 and funded by local authorities under grant agreement 3 ITEA – 18032 – Food Friend
Correspondence to:
Wouter Bijnens
Application Specialist