
Human Energy Expenditure (EE) is not stable over a 24-hour period. It varies depending on the time of day, physical activity, the composition of food intake and the quantity of food. The metabolism of one person is very different from that of another. Besides that, our nutrient utilization at the same energy expenditure levels can differ during the day.
The human 24-hour energy expenditure consists of several components. The components can be identified as different stages of the 24-hour energy expenditure. It is possible to measure the different components of 24-hour energy expenditure by allocating individual components to a timeframe. Despite its complexity, the components of human body 24-h EE can be identified and measured with Indirect Calorimetry (IC) equipment, such as the Room Calorimeter or the Omnical. In this series, we will describe all the EE components.
Today’s topic will be TEF or DIT: The thermic effect of food / diet-induced thermogenesis.
The Thermic Effect of Food explained
The meal- or diet induced thermogenesis (MIT or DIT) is also known as thermic effect of food (TEF). TEF reflects the rise in energy expenditure after food intake or infusion of nutrients. In other words, it is the energy used in digestion, absorption, and distribution of nutrients.
The TEF can be divided into two components: the obligatory and the facultative component. The minimum energy needed to adapt a nutrient into the storage structure that the body will take. The theoretical amount of energy needed to store nutrients has been known for quite some time. In contrast, it is also known that the TEF value measured is always higher than the value based on theory. The higher value represents the facultative component of TEF. In theory, this response is a flexible mechanism by which the excess of energy intake (EI) is expended by the body.
How to measure TEF?
The energy requirements of digesting and processing a meal is indicated by TEF. It can take up to 8-10 to process a large meal. The size of ingested meal and the micronutrients it holds influences the TEF. As a result, researchers express the TEF as a percentage of the EI. By dividing the increase in energy expenditure (after consuming the meal) by the EI, this can be calculated. TEF accounts for roughly 10% of the 24-hours energy expenditure. This percentage is realistic when healthy subjects have an appropriate energy balance and consume a mixed diet. Of course, this value can fluctuate between subjects with a changed or changing energy balance.
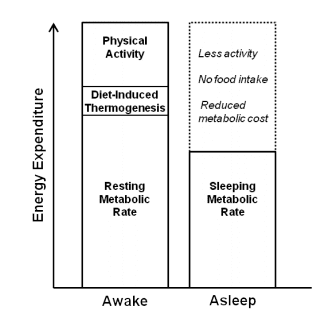
Figure 1 Total daily energy expenditure components.
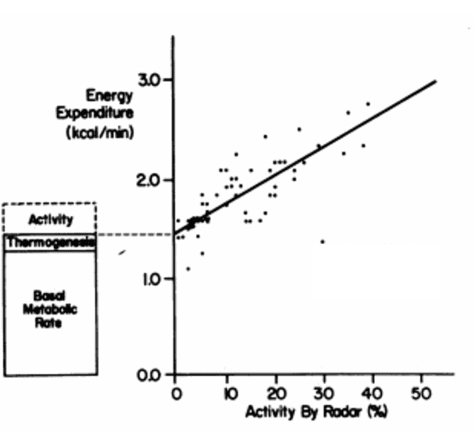
Figure 2 represents the relationship between physical activity and EE. By using a regression analysis, the resting energy expenditure is calculated as the y-intercept and the TEF of all meals is calculated as the divergence between REE and the RMR (of BMR). The energy costs of activity is the slope of the linear regression line.
Alternate study designs
It is difficult to distinguish between increases in BMR/RMR produced by TEF or by the physical activity thermogenesis in a whole-room calorimetry measurement (see Figure 1). One of the components must be reduced by design as much as possible, to tackle this problem.
- Fasting
Subjects can fast one day and then feed the next day. By limiting physical activity, activity thermogenesis is reduced.
- Measure the physical activity and estimate the TEF
Because of the analysis method, this method has a poor biological reproducibility when subjects are measured more than once. With the physical activity data (y-axis) and the EE (x-axis) per unit of time a regression graph is made. The y-intercept shows the energy expenditure of the subject in an inactive status. The cumulative TEF (both components) is represented by the difference between the y-intercept and the BMR/RMR (figure 2).
The whole room calorimeter needs to be adjusted to make the measurement of TEF more accurate and reproducible.
- Supine position
You can also determine the TEF when the subject is lying in a supine position. By doing this, both physical activity and movements are not able to influence the measurement.
Sensitivity of Measurement
The day-to-day coefficient of variation (CVd-to-d) indicates the biological reproducibility of the TEF when using a mixed chamber metabolic cart system with canopy. The CVd-to-d can fluctuate between 15 and 33 %. The method of calculation of TEF, the difference between RMR (measured before meal) and the total post meal EE, results in the elevation in CVd-to-d. Therefore, the TEF can be similar from day to day.
The measurement can be affected negatively by the variability in RMR prior to the meal. By using a fixed RMR several studies attempted to calculate each sequential TEF value, however the improvements in the between day precision and CVd-to-d have been minimal. Improvements in methodology are still a necessity when using a metabolic cart to measure the most accurate TEF.
How can we help you with your research?
Maastricht Instruments has created the equipment in the field for indirect calorimetry measurements.
“The Omnical metabolic cart seems to be the most valid system among metabolic carts for assessing both, RMR and RER.” – Juan M. Alcántara Alcántara, 2020
We provide support for studies, research and measurements alongside our indirect calorimetry products. You can consult us for product support, software support, parameter use, measurement methods and protocols, validation options, data processing and interpretation, correct use of measurement data and additional technical requirements for your study.
Do you plan to measure TEF/DIT/MIT?
If you are interested in measuring TEF/DIT/MIT then consult us about our indirect calorimetry metabolic cart, whole room calorimeter systems or accelerometry add-ons. Please contact us or find more information on our information pages.
- Chen KY, Smith S, Ravussin E, Krakoff J, Plasqui G, Tanaka S, Murgatroyd P, Brychta R, Bock C, Carnero E, Schoffelen P, Hatamoto Y, Rynders C, Melanson EL. Room Indirect Calorimetry Operating and Reporting Standards (RICORS 1.0): A Guide to Conducting and Reporting Human Whole-Room Calorimeter Studies. Obesity (Silver Spring). 2020 Sep;28(9):1613-1625.
- Alcántara Alcántara, Juan Manuel. Assessment of resting energy expenditure and nutrient oxidation by indirect calorimetry: methodological implications. Granada: Universidad de Granada, 2021.
Photo
- Spaeth, Andrea Marie, “Consequences of Chronic Sleep Restriction on Energy Balance in Healthy Adults” (2014)
- Ravussin E, Lillioja S, Anderson TE, Christin L, Bogardus C. Determinants of 24-hour energy expenditure in man. Methods and results using a respiratory chamber. J Clin Invest. 1986 Dec;78(6):1568-78.
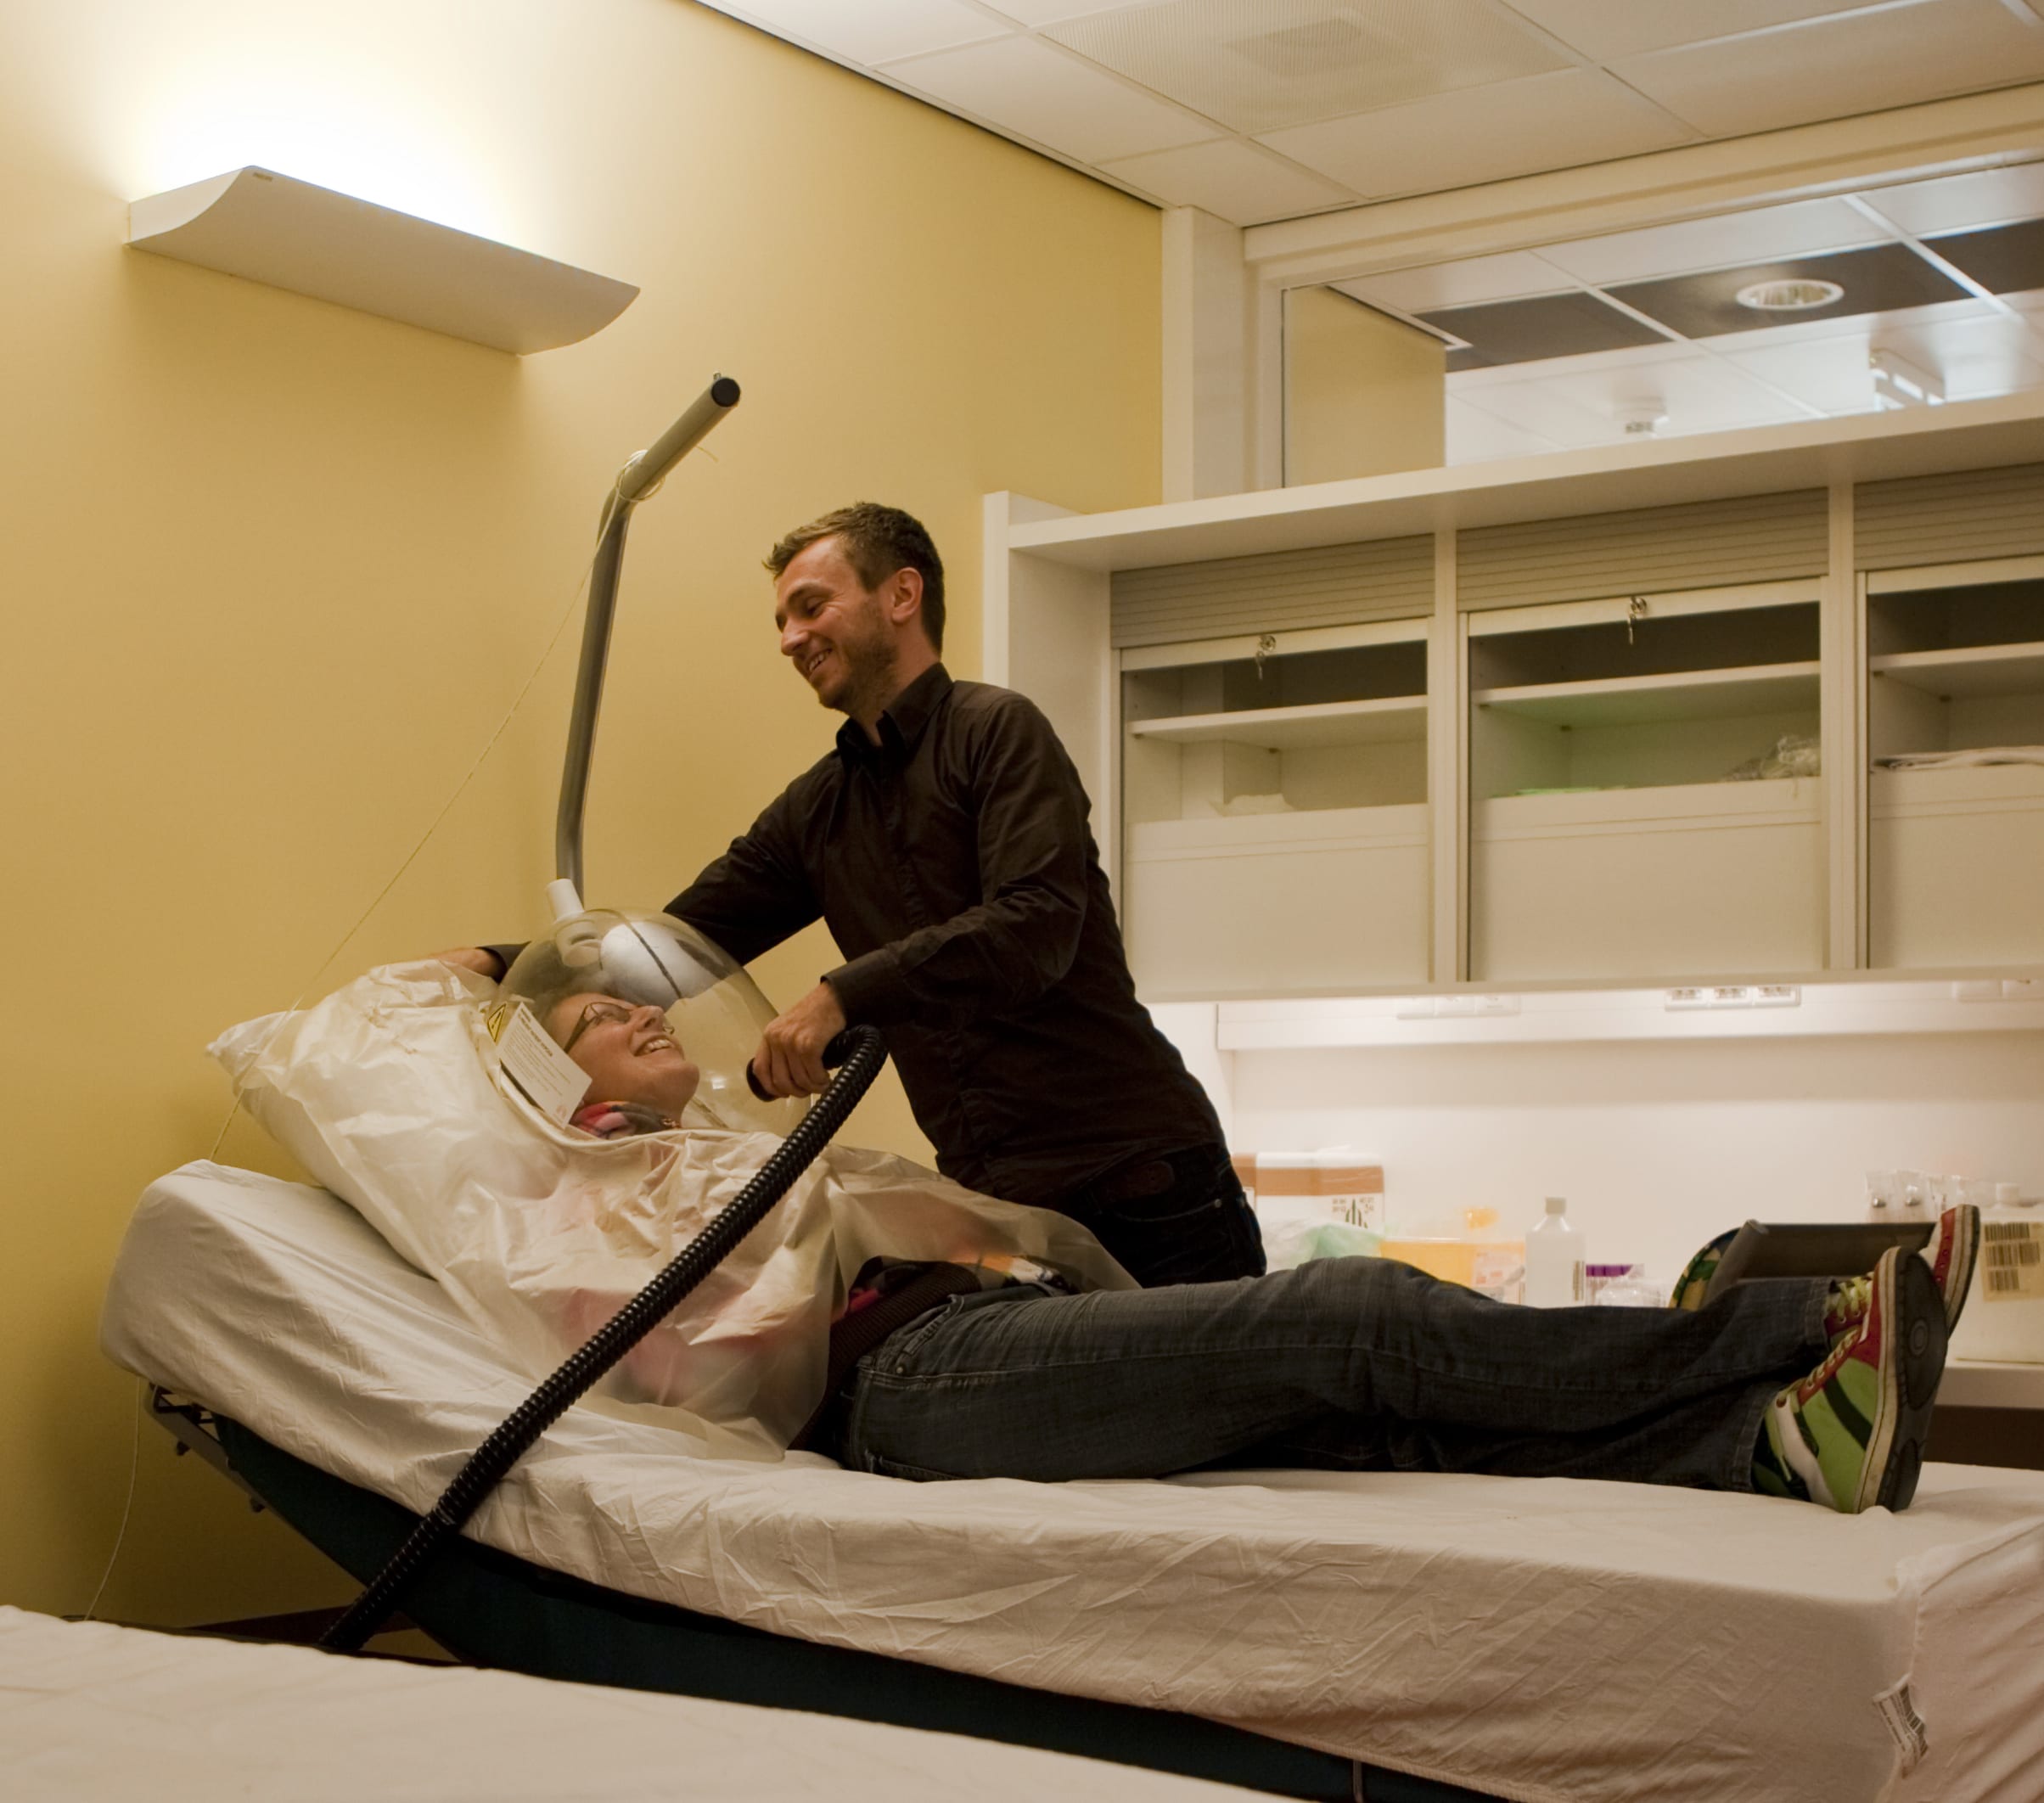
Figure 3 The use of a metabolic hood system with canopy, here at our facilities in Maastricht.